
Weekend Bitcoin Price Action Recap: Breakdown or Pullback?
This weekend was action-packed for Bitcoin traders, with plenty of opportunities to learn, strategize, and observe market behavior. Here’s a detailed breakdown of the price action we saw, complete with insights from the charts and what it means for the week ahead.
Friday: Setting the Stage with a Symmetrical Triangle
On Friday, we identified a symmetrical triangle on the 4-hour RSI. The formation hinted at an impending breakout or breakdown, and we planned to use liquidity pools to predict which way the market might move. The key question was whether Bitcoin would pull back or smash through $100K over the weekend.
Saturday Morning: The Breakdown Confirmed
The action kicked off early on Saturday at 5 a.m., as the 4-hour RSI broke below the triangle’s support trendline (Chart 1). By 9 a.m., I noticed this and shared an update in my Telegram group, confirming the breakdown.

In my update, I called this a high-risk, counter-trend “degen trade” for anyone considering shorting in the face of such a strong daily uptrend. Personally, I opted out of taking the short but outlined initial targets for those with a high appetite for risk.
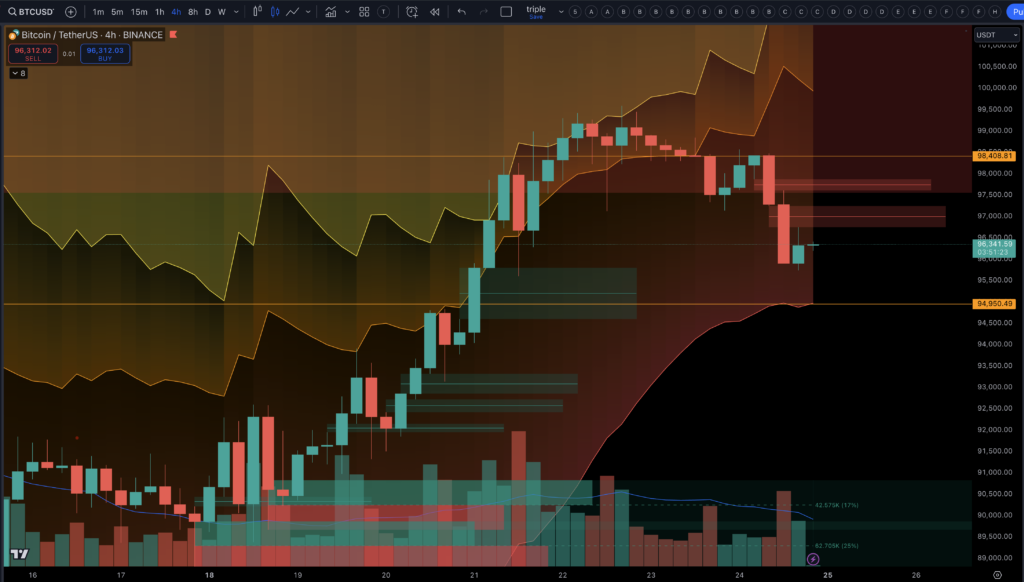
The ultimate 4-hour target was RSI 40, aligning with a price level of $95K. As seen in the chart, Bitcoin first broke below the horizontal support at $98.4K, retested it as resistance, and then plunged below $96K. However, as of now, the full target at $94.9K has not yet been reached (Chart 2).
Daily Breakdown and Hive Sell Signal
By the end of Saturday, the daily time frame confirmed the breakdown (Chart 3). The day closed with a Hive Sell signal, triggered by an aggregation of multiple divergences from various indicators.
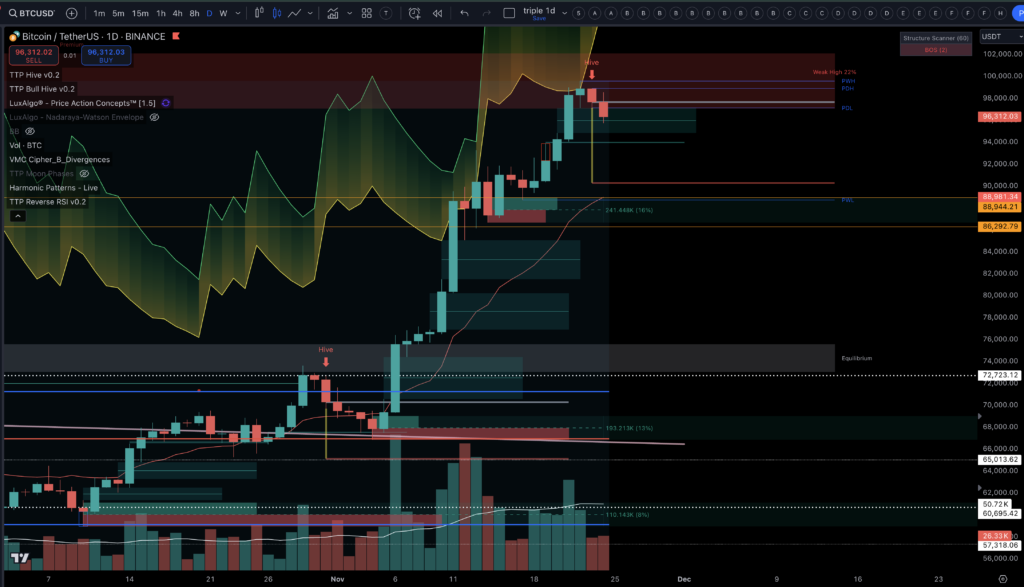
This signal typically targets two times the daily ATR, which places the final target around $90K. While the daily breakdown supports further downside, the overall structure hasn’t been compromised, meaning the bulls are still in control for now.
Liquidity Pools and Weekend Market Dynamics
Looking at short-term liquidity pools (Chart 4), we saw two key developments:

1. Accumulation above $100K: Large liquidity pools formed around $100K and $100.75K, as Saturday’s move down left these areas untouched.
2. New clouds below $95.7K: With the breakdown, long positions stepped in at $96K, creating liquidity all the way down to $95.2K.
If the daily breakdown continues toward the $90K target these long positions would likely be liquidated.
Reversal Risks and Monday’s Outlook
While the short timeframe breakdowns currently favor the bears, there are two strong incentives that could bring a attempt to break 100K on Monday:
1. CME Gap: CME closed Friday at $99.8K, leaving a significant gap of over $3K. Historically, these gaps often act as magnets, pulling price back toward them.
2. Speculation on Michael Saylor: Rumors suggest he might purchase $30K Bitcoin on Monday, creating additional upside pressure.
Key Takeaways for Traders
1. 4-Hour Breakdown: The short-term structure has broken, but the pullback remains minor in the context of the daily uptrend.
2. Daily Breakdown: While bearish signals are confirmed, the bulls still hold the larger trend structure. Proceed with caution if still in a short.
3. Liquidity Pools: With juicy targets above the market remains primed for volatility.
4. Watch for Monday Reversal: With the CME gap and potential buying interest, next week could see a new 100K break attempt.
Final Thoughts
If you’re still in a short position, manage your risk carefully. The overall market structure remains bullish, and this pullback hasn’t confirmed a major trend reversal. For now, the smart play is to wait for Monday’s market open and let the price action guide your next move.
Stay tuned for updates, and keep an eye on the charts—this week promises to be just as exciting as the weekend!


